 We are uniquely positioned, by virtue of LinkedIn’s data, to provide insight into gender equality across every industry represented on the network.
In fact, one of the winning teams of the LinkedIn Economic Graph Challenge is currently working on research that evaluates gender differences in self-promotion on profiles.
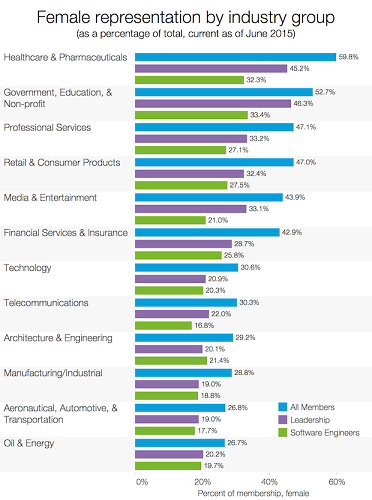
Having released our own workforce diversity numbers and an update on our Women In Tech (WIT) and Women’s Initiative (WiN) efforts last week, and with diversity and inclusion continuing to be an important issue across fields, we decided to take a look at gender parity across several industries. We analyzed millions of profiles and compared female representation across a dozen industry groups – with a detailed look at leadership positions and software engineers. Industry leaders can use this data as a benchmark to measure their progress towards achieving gender equality in the workplace.

An important factor to measure is the leadership gap, which we’re defining as the difference in female representation between membership overall, and members in leadership positions. We have found this gap to be most pronounced in healthcare, retail, and financial services. Looking at healthcare, 59.8% of all members in the industry are women. However, only 45.2% of members in leadership positions are women – a gap of 14.6%. Retail and financial services have a similar gap, with financial services having the lowest absolute representation of women in leadership (28.7%) among the three industry groups we highlighted. In these industries, leadership is less representative of their companies as a whole with regards to gender. For reference, government, education, and nonprofit industries have the narrowest gap (6.4%).
Technology companies are generally considered to be some of the most sought-after employers in the world. We have an inherent “home field advantage” when it comes to recruiting the largest and richest talent pools of our most critical position: software engineers. However, despite this advantage, our data indicates that software engineering teams in tech have proportionally fewer women than several non-tech industries; namely healthcare, retail, government, education, and nonprofits. For example, a typical software engineering team in a healthcare company is likely to be 32% women, compared to 20% in technology. While these non-tech industries employ significantly fewer software engineers versus technology, their teams tend to exhibit greater gender parity.
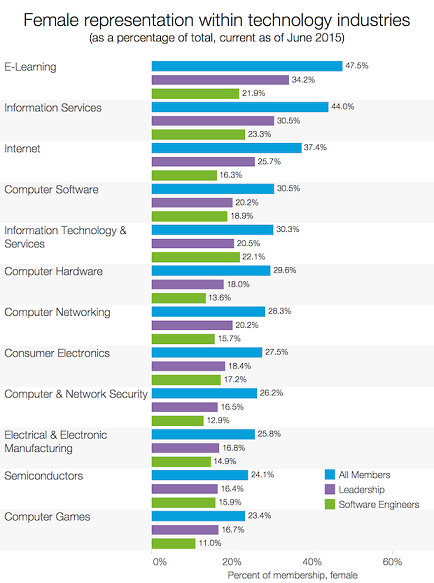
We noticed significant variance within the technology, financial services and insurance industries. Below, we broke out the technology group into its twelve component industries represented on LinkedIn.

Companies that operate in e-learning and information services industries have the most gender equal workforces within our technology group. However, even among these relatively inclusive tech industries, women are still significantly underrepresented within software engineering roles.
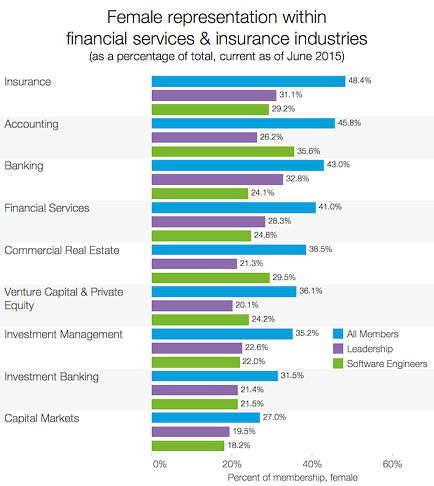
Below, we broke out the financial services and insurance group into its nine component industries represented on LinkedIn.

As we noted above, there is a significant leadership gap in these industries. Accounting, insurance, commercial real estate, and venture capital all have gaps of 16% or more. In accounting firms, women represent nearly half of the total employee base, but only 26% of leadership. The three industries that employ the most software engineers – financial services, insurance, and banking – all tend to include proportionally more women than each of the technology industries we looked at.
As we continue to build the Economic Graph, a digital representation of the global economy, we want to create more transparency for issues like gender diversity by drawing insights from our data, allowing business leaders and members alike to make better informed decisions that ultimately create economic opportunity.
Methodological details: The results of this analysis represent the world as seen through the lens of LinkedIn data. As such, it is influenced by how members choose to use the site, which can vary based on professional, social, and regional culture, as well as overall site availability and accessibility. These variances were not accounted for in the analysis.
Keen observers will note that there is no field for gender on the LinkedIn profile. We have inferred the gender of members included in this analysis by classifying their first names as either male or female. Members whose gender could not be inferred from their first names weren’t included in the analysis. Additionally, we excluded all members in countries where less than 67% of the respective member base could be classified as either male or female, to account for coverage lapses in our gender classifier.
Members in leadership positions were defined as those who have a seniority of director, vice president, CXO, owner, or partner. Software engineers were defined as those whose current title fit one of the following occupational categories: information technology engineer, database programmer / administrator, hardware engineer, software configuration / release manager, oracle developer / database administrator, data center manager, storage engineer, information security specialist, software tester, software developer, technology manager, information technology system administrator / engineer, embedded software engineer, network engineer, research development software engineer, database developer.
Written by Sohan Murthy
Source:LinkedIn
