
 The business of television is rapidly advancing.
Instagram’s recent announcement of serving up long-form vertical video to its 1 Billion+ monthly active users drove Facebook stock up 2.3% in regular trading.
“From both a consumption and a content-creation perspective, IGTV is going directly up against YouTube, which just announced it has more than 1.9 billion monthly logged-in users and is already well established as a place for creators to distribute long form video”, write WIRED’s Louise Matsakis and Lauren Goode.
YouTube Premium, in turn, has found recent success in the form of Cobra Kai.
With numerous new SVOD services on the horizon from Discovery, Viacom, DC, FOX and Disney, the question of “should current measurement advance” is becoming one of “how quickly can current measurement advance”.
The required measurement solution must give anyone in the business of global entertainment the means to gauge the popularity of content in all markets, across all platforms.
Before we dive into how Parrot Analytics has solved this problem, let us first take a step back and look at how SVOD-first digital originals have traditionally fared with audiences worldwide.
First, we will examine two “typical” digital originals: Netflix’s Marvel’s Iron Fist and Marvel’s Luke Cage. Next, we will contrast these with examples of atypical digital originals: Netflix 13 Reasons Why and Stranger Things, and CBS All Access’ Star Trek Discovery.
OTT content adoption curves for typical digital original series
While the launch uptake behavior by a title’s core audience segment is similar across markets, the adoption rate across markets differs. For example, as the chart below shows, the U.S did not enter the top 10 markets for Iron First until long after its release.
Most full-season digital original series feature a similar adoption pattern. Parrot Analytics refers to this as the “digital original demand binge curve”: Audience demand is highest at full season drop and a “second weekend binge spike” is also often observed. Demand then declines rapidly from this point onward.
By 30 days post-release, most of the launch demand for digital original series has dissipated in each of its top markets. Note: This is consequential for a subscriber churn-efficient content strategy.
OTT content adoption curves for atypical digital original series
Stranger Things was the first breakout “smash hit” digital original series for any digital platform globally. The show broke the mold for the format and featured the slowest demand dissipation curve of any other digital original series, including longer-running, multi-season shows. We have also observed that season two of the series has followed this same atypical pattern.
In the chart below, note the 4-month time horizon for season two, compared to the previous 30-day curve for Marvel’s Iron Fist, which is typical with practically every other digital original series. In Stranger Things, Netflix has created a digital original quite unlike any another – except perhaps 13 Reasons Why.
There are many content success factors contributing to the success of titles like Stranger Things and its implications on the content strategy for companies like Netflix, Amazon, Hulu, Facebook, Apple and YouTube.
These factors are being studied in-depth with our Content Genome™ initiative – a foundation that drives content production, windowing, distribution and marketing decisions.
For contrast, let us now compare an equally popular though different release pattern for a digital original series. Star Trek: Discovery first premiered on hybrid linear / SVOD and then exclusively on CBS All Access in the US, cable in Canada and Netflix globally. Here we observe that this title features the typical episodic spike patterns shown by traditional linear and cable shows (which makes this an atypical SVOD release).
 Consequently, Star Trek: Discovery has maintained its global velocity well into the first quarter of 2018.
We have established that the business of television is rapidly advancing and even in the relatively “new” world of SVOD there are already several accepted post-launch demand patterns.
Let us now examine how Parrot Analytics has standardized international title health analysis across broadcast, pay TV and OTT platforms. To make this possible, we rely on global TV demand data.
Let’s dive in!
A standardized method for global title health analysis across all platforms
When we discuss some of the most critical business challenges facing the owners of show rights, we often hear the following two questions:
“How can I get a thorough understanding of a title’s international demand?”, and “What additional context is available on a title’s global performance?”
These types of questions have traditionally been very hard to answer without access to global TV demand data. Additionally, viewership data can only be obtained once a title has already been sold in a market.
To answer these questions, along with categorically establishing a title’s international popularity by leveraging globally standardized TV demand data, Parrot Analytics has introduced the Title Health Analysis report.
Uncovering the demand for a TV series globally using a Parrot Analytics Title Health Analysis report can unlock specific insights to drive, for example, a title’s international sales strategy.
Contextualizing the performance of a title using globally standardized rankings
Ranking a TV show in the context of global demand yields insights as to the strength of the title’s worldwide performance. To illustrate this, we will take the example of US comedy The Good Place.
Airing on NBC in the US and available on Netflix in most other markets, The Good Place was very well received worldwide. Over the release period of the most recent season (September 2017 to March 2018), The Good Place is the 173rd most in-demand title in the world.
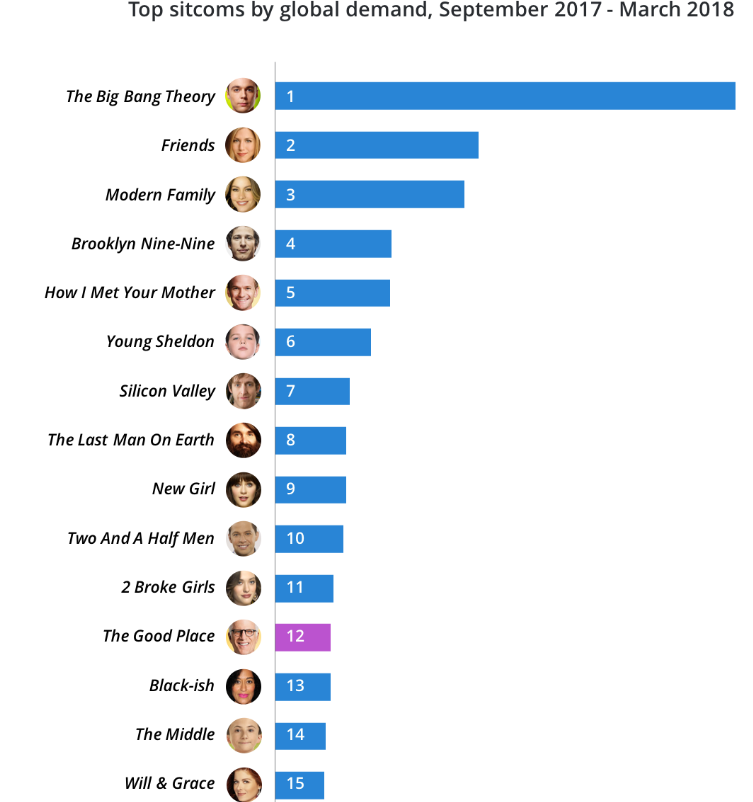
Refining this further to position the show with respect to comparable titles, we see that over the same timeframe The Good Place is also the world’s 12th most in-demand sitcom.
This obviously makes The Good Place a very strong global title. To demonstrate this strong performance further, we can contextualize the most in-demand comedies worldwide with a distribution curve.
 This type of graph plots the rank of the top 500 comedy titles against their average global demand per capita. The average global demand of these 500 titles is marked with “1x average demand”, whilst 5 times the global average is marked with “5x average demand”.
This chart illustrates just how difficult it is for shows to stand out in their genre. Only a small fraction of the top comedy titles even exceed the average: With 4 times more global demand than the average show, The Good Place is one of these titles.
Global data aggregation reveals the major TV events that drive worldwide demand
Show-related events such as trailer launches, cast interviews and, most importantly, new episode releases can affect the demand for a title, even in markets where no promotional events or campaigns are running. This also holds true for markets that do not have official (commercially licensed) access as yet.
Significant increases in global demand can therefore be used to easily identify events that raised demand the most. To demonstrate this, the daily global demand for the most recent season of The Good Place and for comparative purposes, fellow NBC sitcom Superstore which also premiered a new season in September 2018, is shown.
By leveraging globally standardized TV demand data, we can establish that there is a clear audience response for The Good Place, and we can quantify this on a daily average basis: Global daily demand increases for the season 2 premiere on September 20, with each subsequent episode also visible as “daily global demand spikes”. Worldwide demand for The Good Place then remains at a high baseline during the show’s midseason break over the winter holidays.
The fact that the show was available internationally on Netflix within 24 hours of the US broadcast kept global enthusiasm for each episode concentrated, as audiences did not have to wait for the official releases in their respective country.
The same type of patterns is visible for season 3 of Superstore, although this title overall has lower global demand compared to The Good Place.
Global demand breakdown shows how fans are interacting with a title, and each other
Demand breakdown reveals which methods fans are preferentially using to express their demand for a title. For this article, we have aggregated these methods into three categories: Video consumption, research and social media. By knowing how fans are engaging with content, global strategies can be adjusted, for example if the share from social media is low then the show may benefit from an increased official social media presence to encourage fans to share and discuss the series online.
To showcase this type of analysis, the chart below reveals the global demand breakdown for the Netflix reality show Queer Eye, from the period the show was relaunched on the service in early February 2018. The major markets that had the highest share for each type of demand driver have also been provided.
Video consumption including piracy is highest in Russia: We can speculate that viewers in notoriously homophobic Russia are unwilling to discuss or research the show online. Queer Eye’s research share of demand is highest in Sweden and neighboring Norwegian audiences are predominately expressing their demand on social media.
The dissimilarities in the Norwegian and Swedish global demand contribution shares illustrates that even between markets that may be (wrongly) assumed to be similar by outsiders, there can be significant differences in how audiences engage with content.
Travelability: How popular is a title relative to its home market?
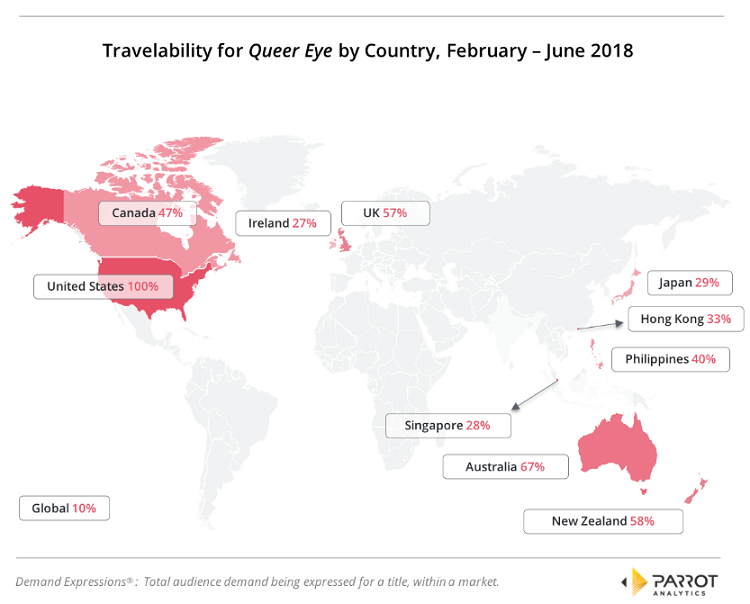
To identify the markets where a title is currently performing strongest, a travelability analysis is performed: This analysis calculates the Demand Expressions per 100 capita of the title in every market and normalizes these to the demand in the show’s home market.
As an example for this type of analysis, we will again use Netflix’s Queer Eye and examine its demand since the reboot’s February 2018 release.
As Queer Eye’s home market of the U.S. is taken as the normalization point, it naturally has 100% travelability. The next highest travelability market is Australia, which has 67% of the U.S. home market demand; this confirms that the U.S. is the best market for this show.
We believe that this is an unsurprising result for two reasons: Firstly, most titles typically perform best in their home market and secondly, in this instance it can be argued that Queer Eye is a US-set reality show with a point of view that is strongly rooted in American culture.
The Australian popularity is also an expected result as the sole special episode of Queer Eye so far takes place in that country. This indicates that one method Netflix could use to improve Queer Eye’s popularity in other markets, quite simply, is to set more episodes in other countries: The best candidates for additional specials are the other English-speaking markets in the top 5 markets for the show, these are New Zealand, the UK and Canada.
Most of the remainder of the top ten are Asian countries, with the Philippines displaying the highest demand of these.
The relatively high demand for Queer Eye in both Australia and New Zealand means that Oceania is the region where the show performs best, with North America second. As would be expected from the top countries for travelability, Asia is the next highest region.
At the other end of the scale, the Middle East region has very low demand for this series with only 1.5% of U.S. demand.
A title health analysis reveals market-specific insights for 100+ countries
To inform content owners about a show’s performance in the markets that are most important to them, the Title Health Analysis report can be customized to go into detail about how all of the above metrics change in 100+ global markets.
This allows for the identification of similarities and differences of how audiences are interacting with a title across territories of interest.
Let us now look at two specific examples of the types of data and insights that can be gleamed from a country-level analysis.
For the first, we will return to The Good Place as our example title, comparing the global rankings with its rankings in two specific markets:
This shows that while the U.S. rankings are over-performing compared to the global average (+108 positions above the global rank), The Good Place ranks lower than the global average rank in Germany (-135).
The lower-than-average German performance may be due to strong local competition, an unappealing translation, a lack of awareness about the show in the market or any number of potential issues. Knowing that this is a weaker market allows the cause to be investigated and hopefully addressed.
Moving to the other example title, we can contrast the demand breakdown for France and Australia for Queer Eye:
We observe that both countries have a higher demand contribution from social media than the global demand breakdown (as discussed earlier in this article). The difference exists in that French audiences are more prone to express demand via video consumption, while Australians are more likely to express demand via research.
These country-level insights allow for a title strategy to be expanded to address the specific environment of each market.
Expanding the Title Health Analysis: Demographics, comparison deep dives and more
Parrot Analytics’ data science and customer success teams work closely with each customer to answer specific global research questions. The Title Health Analysis report outlined in this article is just one way we add value to the customer teams we interface with.
Naturally this type of analysis can be extended in any number of ways to answer the exact business questions concerning a specific title, such as:
A demographic analysis to determine if and how the show has reached past its core demographic in any market.
A more detailed comparisons to similar titles to see where the title over-indexes and where there are opportunities for the show to improve.
Any other custom additions that would give you the information you need to make your show the best it can be, globally.
Source: Parrot Analytics