
 IATA World Air Transport Statistics Released-
The International Air Transport Association (IATA) announced industry performance statistics for 2017. Worldwide annual air passenger numbers exceeded four billion for the first time, supported by a broad-based improvement in global economic conditions and lower average airfares. At the same time, airlines connected a record number of cities worldwide, providing regular services to over 20,000 city pairs* in 2017, more than double the level of 1995. Such increases in direct services improve the industry’s efficiency by cutting costs and saving time for both travelers and shippers alike.
This information is included in the recently released 62nd Edition of the World Air Transport Statistics (WATS), the yearbook of the airline industry’s performance.
“In 2000, the average citizen flew just once every 43 months. In 2017, the figure was once every 22 months. Flying has never been more accessible. And this is liberating people to explore more of our planet for work, leisure and education. Aviation is the business of freedom,” said Alexandre de Juniac, IATA’s Director General and CEO.
Highlights of the 2017 airline industry performance:
Passenger
· System-wide, airlines carried 4.1 billion passengers on scheduled services, an increase of 7.3% over 2016, representing an additional 280 million trips by air.
· Airlines in the Asia-Pacific region once again carried the largest number of passengers. The regional rankings (based on total passengers carried on scheduled services by airlines registered in that region) are:
1. Asia-Pacific 36.3% market share (1.5 billion passengers, an increase of 10.6% compared to the region’s passengers in 2016)
2. Europe 26.3% market share (1.1 billion passengers, up 8.2% over 2016)
3. North America 23% market share (941.8 million, up 3.2% over 2016)
4. Latin America 7% market share (286.1 million, up 4.1% over 2016)
5. Middle East 5.3% market share (216.1 million, an increase of 4.6% over 2016)
6. Africa 2.2% market share (88.5 million, up 6.6% over 2016).
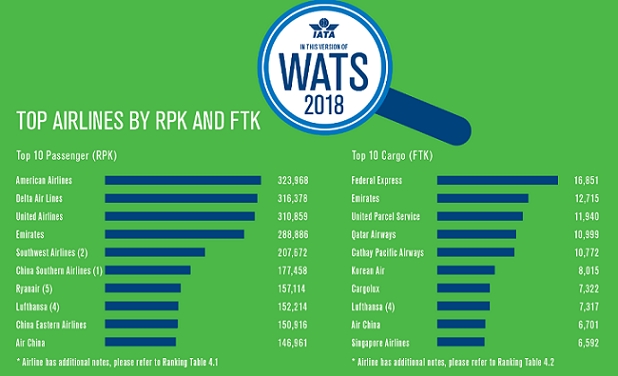
· The top five airlines ranked by total scheduled passenger kilometers flown, were:
1. American Airlines (324 million)
2. Delta Air Lines (316.3 million)
3. United Airlines (311 million)
4. Emirates Airline (289 million)
5. Southwest Airlines (207.7 million)
· The top five international/regional passenger airport-pairs were all within the Asia-Pacific region, again this year:
1. Hong Kong-Taipei Taoyuan (5.4 million, up 1.8% from 2016)
2. Jakarta Soekarno-Hatta-Singapore (3.3 million, up 0.8% from 2016)
3. Bangkok Suvarnabhumi-Hong Kong (3.1 million, increase of 3.5% from 2016)
4. Kuala Lumpur–Singapore (2.8 million, down. 0.3% from 2016)
5. Hong Kong-Seoul Incheon (2.7 million, down 2.2% from 2016)
· The top five domestic passenger airport-pairs were also all in the Asia-Pacific region:
1. Jeju-Seoul Gimpo (13.5 million, up 14.8% over 2016)
2. Melbourne Tullamarine-Sydney (7.8 million, up 0.4% from 2016)
3. Fukuoka-Tokyo Haneda (7.6 million, an increase of 6.1% from 2016)
4. Sapporo-Tokyo Haneda (7.4 million, up 4.6% from 2016)
5. Beijing Capital-Shanghai Hongqiao (6.4 million, up 1.9% from 2016)
· One of the interesting recent additions to the WATS report is the ranking of passenger traffic by nationality, for international and domestic travel. (Nationality refers to the passenger’s citizenship as opposed to the country of residence.)
1. United States of America (632 million, representing 18.6% of all passengers)
2. People’s Republic of China (555 million or 16.3% of all passengers)
3. India (161.5 million or 4.7% of all passengers)
4. United Kingdom (147 million or 4.3% of all passengers)
5. Germany (114.4 million or 3.4% of all passengers)
Cargo
· Globally, cargo markets showed a 9.9% expansion in freight and mail tonne kilometers (FTKs). This outstripped a capacity increase of 5.3% increasing freight load factor by 2.1%.
· The top five airlines ranked by scheduled freight tonne kilometers flown were:
1. Federal Express (16.9 billion)
2. Emirates (12.7 billion)
3. United Parcel Service (11.9 billion)
4. Qatar Airways (11 billion)
5. Cathay Pacific Airways (10.8 billion)
Airline Alliances
Star Alliance maintained its position as the largest airline alliance in 2016 with 39% of total scheduled traffic (in RPKs), followed by SkyTeam (33%) and oneworld (28%).