 Long prevalent stereotypes of consumption patterns across states and population strata are being decimated as Indian consumers evolve and physically relocate.
Increasing urbanisation, higher levels of awareness and improved infrastructure are all contributing to the trend. As business leaders rush to make sense of these evolving patterns, some clear trends are emerging through market analysis.
Our studies have shown that the emerging hinterlands of Orissa, Madhya Pradesh, Chhattisgarh, Bihar and Jharkhand are at a pivotal stage and likely to drive the next wave of growth in India. For marketers who can optimise their strategies, these states can prove to be an effective buffer against declining sales figures.
The Unique Story Of The Hinterlands
The states of Madhya Pradesh, Chhattisgarh, Bihar, Jharkhand and Orissa add up to about a quarter of India’s population. They have a low rate of earning per household but a growth rate of 15%, which is at par with the rest of India. Broadly, this means that it is a region with more people, who have lower average spends but a good propensity for growth. Here are some of the top trends in these regions:
Urbanisation: In all these states apart from Madhya Pradesh, urban households are growing faster than rural. The inevitable repercussions of urbanisation are visible in these clusters, including smaller family sizes, a demand for premium products, the need for convenience and the popularity of discretionary offerings. Household spending on non-basic consumption items like consumer durables, personal vehicles and services—such as banking, insurance, education and entertainment, among others—are on the rise. Also, the proportion of aspirational spending to total household expenditures is at par with the national average. This is a particularly telling statistic since the average household earning and consumption spends in these states is 14%, which is below the national average.
The New Rural: Urbanisation may be growing, but those who have remained in rural areas have progressed considerably on the back of government initiatives. This is especially significant for this region because, of 181 million rural households in India, 27% are located here and account for 19% of rural household expenditure in India. Bihar, with 90% rural households, and Orissa, with 85%, have the highest densities of rural households in the country. Significantly, the two states also have a higher than national average growth rate when it comes to rural households.
Increased Affluence: Increased awareness fuelled by smartphone penetration and communication connectivity in general has led market analysts to predict an increase in aspiration among households. As per industry estimates, households within the income bracket of 1.8 lakh and 4.85 lakhs per year will increase from 14 million in 2012 to 25 million by 2025 in the three states of Madhya Pradesh, Orissa and Chhattisgarh.
The most relevant trend in these states is the prominent growth of high-income households with earnings of over 5 lakhs a year. Low income households that earn between INR 75,000 and INR 1.5 lakhs per year are a chunk of the population but declining steadily. It is the middle-and high-income households that seem to be on the rise, and this bodes well particularly for the FMCG sector, because it creates opportunities for innovation, new category proliferation, evolved product mix and a depth of range.
Growth Is Here To Stay
These state clusters have shown a gross domestic product (GDP) growth rate of 16%, which is higher than the national average, and comparable to some of the most developed states in India. At a granular level, it is Orissa, Bihar and Madhya Pradesh that have fuelled high growth. While all these state groups mirror all-India growth rates in the FMCG sector, Orissa is growing at three times the national average. Moreover, some pockets in these states like rural Bihar and Jharkhand, and urban Orissa have shown greater resilience in the slowdown over 2013-14 before FMCG trends started looking up since H2 2014.
A SIZEABLE OPPORTUNITY
While most of these states show a preference for smaller packs at lower price points for the purchase of impulse foods and personal care products, Orissa shows a preference for larger “family packs.” In a confirmatory trend that indicates an increasing ability to spend, the price band above the INR 100 range grew fastest in all three state groups. This may be led by price benefits offered by larger family packs on regular consumption categories, which marketers can use to drive volumes.
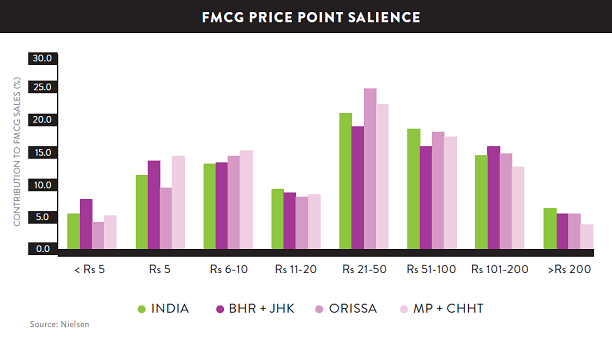
Source:Nielsen